View a Dashboard
View a dashboard by specifying values to the following then clicking the (Apply) button.
-
View based on Category
-
Time Periods
-
Number of Periods
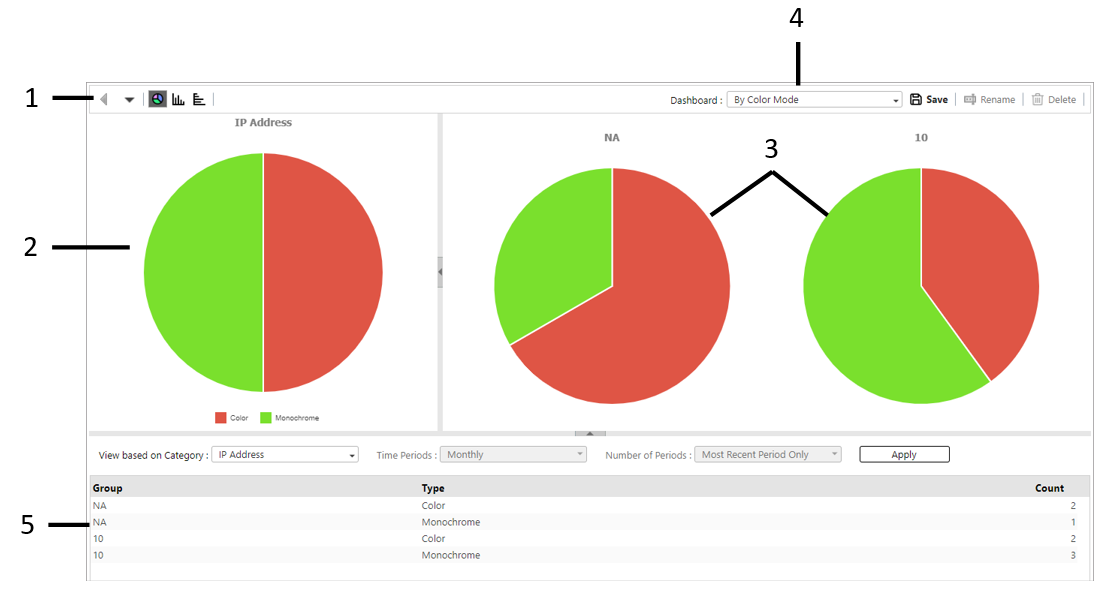
The dashboard layout is described below.
-
Graph Toolbar
You can use the toolbar at the top of the dashboard dialog box to perform the following operations:
Button Function 
Returns to the previous group level on the dashboard.

Displays a list of layers up.

Changes all displayed graphs to pie charts.

Changes all displayed graphs to vertical bar graphs.

Changes all displayed graphs to horizontal bar graphs.

Changes all displayed graphs to line graphs.
-
Main Graph Pane.
This displays the main graph of the selected dashboard. Depending on the setting, the graph may appear as a pie chart, vertical bar graph, horizontal bar graph, or line graph.
Depending on the [Number of Periods] setting, the types of graphs that can be displayed may vary.
-
Detailed Graphs Pane
This displays the data of sub-groups for the group displayed in the main graph.
-
Dashboard Selection
Allows you to navigate to other dashboard within the selected type.
-
Data Table Pane
This displays detailed data in a table based on the data displayed in the main graph.
You cannot print the graphs and tables.